Did you know that the average day trader spends about 7 hours a day glued to their screens, yet many still forget to wear pants? In the world of day trading, success often hinges on the right indicators. This article dives into the essentials of effective day trading analysis, highlighting the best indicators to enhance your strategies. From moving averages and volume indicators to the significance of MACD and RSI, we explore how these tools can refine your decision-making. Learn how candlestick patterns and trend indicators play a crucial role, and discover the importance of support and resistance levels. We'll also cover effective chart patterns, the Stochastic Oscillator, and the Fibonacci retracement. Plus, find out how to combine indicators for a comprehensive approach and avoid common mistakes. With insights from DayTradingBusiness, you'll be equipped to select the right indicators tailored to your trading strategy.
What are the best indicators for day trading analysis?
The best indicators for day trading analysis include:
1. Moving Averages (MA): Helps identify trends by smoothing price data.
2. Relative Strength Index (RSI): Measures momentum and identifies overbought or oversold conditions.
3. Moving Average Convergence Divergence (MACD): Shows trend direction and momentum through the relationship between two moving averages.
4. Bollinger Bands: Provides insight into volatility and price levels relative to historical data.
5. Volume: Confirms trends and signals potential reversals by analyzing trading activity.
6. Fibonacci Retracement: Identifies potential support and resistance levels based on the Fibonacci sequence.
Using these indicators can enhance your day trading strategy and improve decision-making.
How do moving averages improve day trading decisions?
Moving averages improve day trading decisions by smoothing out price data, helping traders identify trends and potential reversal points. They provide clear buy and sell signals when price crosses above or below the moving average. Short-term moving averages react quickly to price changes, allowing traders to capture quick opportunities. Additionally, they can help filter out market noise, making it easier to see the prevailing trend and enhance entry and exit timing. Overall, moving averages are essential for making informed, data-driven trading decisions.
What role do volume indicators play in day trading?
Volume indicators are crucial in day trading as they help traders gauge market strength and confirm price movements. High volume often signals stronger trends, while low volume may indicate a lack of conviction. Indicators like the Volume Moving Average or On-Balance Volume can reveal whether buying or selling pressure dominates. By analyzing volume alongside price action, day traders can identify potential entry and exit points, enhancing their strategies for better decision-making.
How can RSI help identify overbought or oversold conditions?
RSI, or Relative Strength Index, helps identify overbought or oversold conditions by measuring the speed and change of price movements. It ranges from 0 to 100, with values above 70 indicating overbought conditions and below 30 signaling oversold conditions. When RSI is above 70, it suggests that a security may be overvalued and due for a correction. Conversely, an RSI below 30 indicates a potential undervaluation, signaling a buying opportunity. Traders often use these levels to make decisions about entry and exit points in day trading.
What is the significance of MACD in day trading strategies?
MACD (Moving Average Convergence Divergence) is significant in day trading strategies for several reasons. It helps traders identify potential buy and sell signals through its crossover points. When the MACD line crosses above the signal line, it indicates a bullish trend, suggesting a buy opportunity. Conversely, when it crosses below, it signals a bearish trend, indicating a sell opportunity.
Additionally, MACD can indicate the strength of a trend through its histogram, helping traders gauge momentum. This makes it a valuable tool for confirming trends and timing entries and exits in fast-paced day trading environments. By analyzing MACD in conjunction with price action, traders can enhance their decision-making and improve their overall strategy effectiveness.
How do Bollinger Bands assist in day trading?
Bollinger Bands help day traders identify market volatility and price levels. The bands consist of a middle line (SMA) and two outer lines that adjust based on market fluctuations. When prices touch the upper band, it may signal overbought conditions; touching the lower band can indicate oversold conditions. Traders often look for price reversals or breakouts when prices approach these bands. Additionally, the width of the bands can signal potential volatility; narrow bands suggest low volatility and potential price movement, while wide bands indicate high volatility. Using Bollinger Bands in conjunction with other indicators can enhance trading decisions and improve entry and exit points.
What are the key benefits of using candlestick patterns in analysis?
Candlestick patterns offer several key benefits in day trading analysis. They provide clear visual cues about market sentiment, helping traders quickly gauge bullish or bearish trends. Patterns like dojis and hammers signal potential reversals, while engulfing patterns indicate strong momentum. This allows for timely entry and exit points, enhancing decision-making. Additionally, candlestick patterns can be combined with other indicators, improving the accuracy of predictions. Overall, they simplify complex data, making it easier to interpret price action effectively.
How can traders use the Average True Range (ATR) in day trading?
Traders can use the Average True Range (ATR) in day trading to gauge market volatility and set stop-loss levels. A higher ATR indicates increased volatility, suggesting wider stop-loss distances and potential profit targets. Conversely, a lower ATR means tighter stops and targets.
Traders often monitor ATR to adjust position sizes; larger ATR values might warrant smaller positions to manage risk effectively. Additionally, ATR can help identify breakout opportunities; when price moves significantly beyond the ATR, it may signal a strong trend. Overall, incorporating ATR aids in making informed decisions on risk management and trade entries.
What is the importance of trend indicators in day trading?
Trend indicators in day trading are crucial for identifying market direction and timing trades effectively. They help traders spot upward or downward trends, which aids in making informed buy or sell decisions. By using indicators like moving averages or the Relative Strength Index (RSI), traders can confirm trends, avoid false signals, and optimize entry and exit points. This leads to better risk management and improved profitability in fast-paced trading environments.
How do support and resistance levels impact day trading?
Support and resistance levels guide day trading decisions by indicating potential price reversal points. When a stock approaches a support level, it may bounce back, signaling a buying opportunity. Conversely, near resistance levels, prices often drop, suggesting a sell or short position. Traders use these levels to set entry and exit points, manage risk, and identify trends. Effective day traders analyze these indicators to enhance their strategies and improve profitability.
Learn about How Do SEC Rules Impact Day Trading?
What are the most effective chart patterns for day traders?
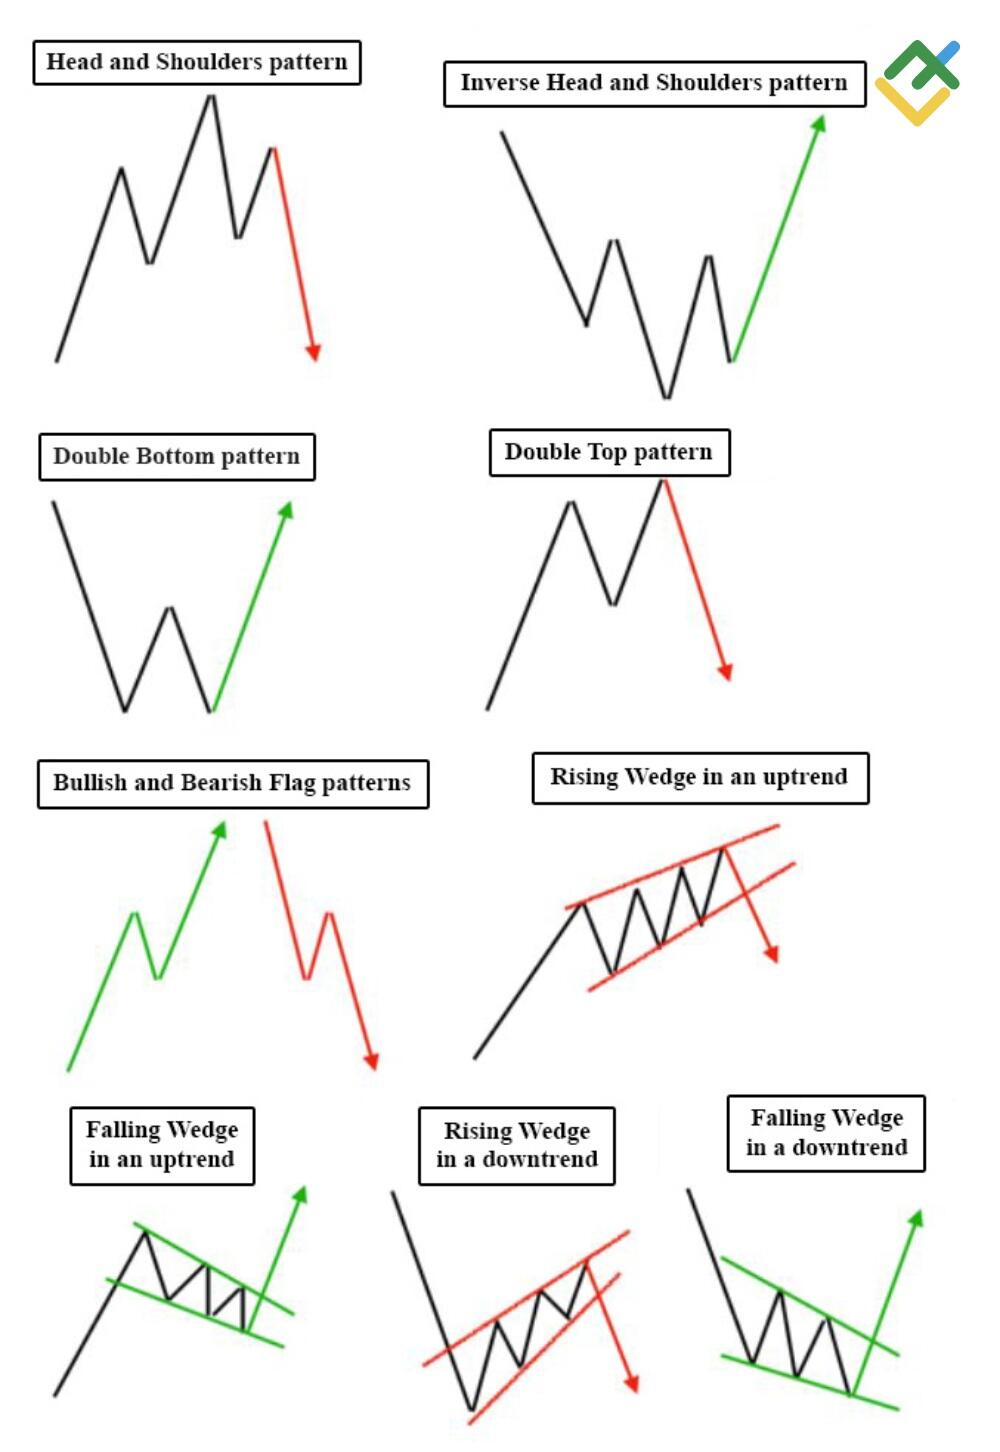
The most effective chart patterns for day traders include:
1. Head and Shoulders: Signals trend reversals; the completion indicates a potential reversal.
2. Double Top and Double Bottom: Indicates potential reversals; double tops suggest selling pressure, while double bottoms indicate buying pressure.
3. Flags and Pennants: Continuation patterns that signal a brief consolidation before the previous trend resumes.
4. Triangles: Ascending, descending, and symmetrical triangles indicate potential breakouts in either direction.
5. Cup and Handle: Suggests bullish continuation; the handle forms after the cup and signals a buying opportunity.
Use these patterns alongside indicators like RSI or MACD for confirmation.
How can traders interpret the Stochastic Oscillator for better trades?
Traders can interpret the Stochastic Oscillator by looking for overbought and oversold conditions. When the indicator is above 80, it signals overbought conditions, suggesting a potential price drop. Conversely, readings below 20 indicate oversold conditions, hinting at a possible price increase.
Additionally, traders should watch for divergence between the Stochastic Oscillator and the price action. If the price makes a new high but the oscillator doesn’t, it may signal a reversal. Using crossovers can also be effective; a bullish signal occurs when the %K line crosses above the %D line, while a bearish signal happens when %K crosses below %D.
Combining these signals with other indicators or price action can enhance trading decisions.
What is the role of Fibonacci retracement in day trading?
Fibonacci retracement helps day traders identify potential reversal levels in price movements. By plotting key Fibonacci levels (23.6%, 38.2%, 50%, 61.8%, and 78.6%) on a price chart, traders can spot where a stock might pull back before continuing its trend. This tool aids in setting entry points, stop-loss orders, and profit targets, enhancing decision-making during trades. Using Fibonacci retracement effectively can improve trade timing and risk management in day trading.
How to combine multiple indicators for enhanced day trading analysis?
To combine multiple indicators for enhanced day trading analysis, start by selecting a mix of trend, momentum, and volume indicators. For example, use a moving average for trend direction, the Relative Strength Index (RSI) for momentum, and the Volume Weighted Average Price (VWAP) for confirmation.
1. Trend Indicators: Choose a short-term moving average (like the 9 or 20 EMA) to identify the trend direction.
2. Momentum Indicators: Apply the RSI to gauge overbought or oversold conditions, looking for divergences with price action.
3. Volume Indicators: Incorporate VWAP to determine market strength and potential reversal points.
Combine signals: Enter trades when the trend indicator aligns with momentum and volume signals—like buying when the price is above the moving average, RSI is below 30, and volume spikes above the average. Regularly backtest your strategy to refine your approach and ensure effectiveness.
Learn about How to Combine Charting with Day Trading Strategies
What mistakes should traders avoid when using indicators?

Traders should avoid these mistakes when using indicators:
1. Overreliance on Indicators: Don’t depend solely on indicators; combine them with price action and market context.
2. Ignoring Market Conditions: Indicators can give false signals in trending or sideways markets. Always consider the broader market environment.
3. Using Too Many Indicators: Avoid cluttering your charts. Stick to a few reliable indicators that complement each other.
4. Neglecting Backtesting: Test indicators on historical data before using them in live trading to understand their effectiveness.
5. Ignoring Time Frames: Ensure the indicators you use are appropriate for your trading time frame. Short-term indicators can give different signals than long-term ones.
6. Forgetting to Adjust Settings: Default settings may not suit your trading style. Customize indicators to fit your strategy.
7. Emotional Trading: Don’t let emotions dictate trades based on indicator signals. Stick to your plan and criteria.
8. Chasing Signals: Avoid entering trades based on lagging indicators. Wait for confirmation to reduce false signals.
By steering clear of these pitfalls, traders can enhance their effectiveness when using indicators.
How can day traders select the right indicators for their strategy?
Day traders can select the right indicators by following these steps:
1. Define Goals: Identify your trading goals and style—scalping, momentum trading, or range trading.
2. Choose Key Indicators: Focus on a few essential indicators. Common choices include Moving Averages for trend direction, RSI for momentum, and Bollinger Bands for volatility.
3. Test Indicators: Use backtesting to see how indicators perform with your strategy under various market conditions.
4. Combine Indicators: Use a mix of trend-following and momentum indicators to get a balanced view.
5. Keep It Simple: Avoid overcomplicating with too many indicators; this can lead to confusion.
6. Adapt and Adjust: Be flexible. As market conditions change, be ready to adjust your indicators or strategy accordingly.
Select indicators that complement your trading style and enhance decision-making.
Learn about How to Choose the Right Indicators for Day Trading
Conclusion about Using Indicators for Effective Day Trading Analysis
Incorporating the right indicators is essential for successful day trading analysis. From moving averages to RSI and MACD, each tool contributes to a clearer understanding of market trends and conditions. Volume indicators and candlestick patterns provide valuable insights, while support and resistance levels help define entry and exit points. By combining these indicators thoughtfully and avoiding common pitfalls, traders can refine their strategies and enhance their decision-making processes. For those looking to deepen their trading knowledge, DayTradingBusiness offers comprehensive resources and guidance to navigate these complexities effectively.
Learn about Using Charting Software for Day Trading Analysis