Did you know that high-frequency traders can execute thousands of trades in the blink of an eye—faster than you can say "buy low, sell high?" In the fast-paced world of high-frequency trading (HFT), evaluating performance is crucial for success. This article dives into essential metrics for assessing HFT effectiveness, including liquidity impacts, latency's role, and key profitability indicators. We’ll explore risk assessment techniques, the significance of order execution quality, and how transaction costs can skew performance evaluations. Additionally, you'll discover the importance of backtesting, market impact metrics, and the relevance of win rates and Sharpe ratios. With insights on the differences between HFT and traditional trading metrics, as well as available tracking tools, you’ll be well-equipped to navigate the complexities of HFT with the expertise of DayTradingBusiness.
What are the essential metrics for evaluating HFT performance?
The essential metrics for evaluating high-frequency trading (HFT) performance include:
1. Sharpe Ratio: Measures risk-adjusted return, indicating how much excess return you’re getting for the volatility taken.
2. Alpha: Represents the excess return of the strategy over a benchmark, showing the strategy's value-add.
3. Beta: Assesses the strategy's sensitivity to market movements, helping to understand systematic risk.
4. Win Rate: The percentage of profitable trades, indicating the effectiveness of the trading strategy.
5. Average Trade Profit: Measures the average gain or loss per trade, providing insight into trade efficiency.
6. Maximum Drawdown: The largest peak-to-trough loss, highlighting risk exposure during adverse market conditions.
7. Execution Speed: Time taken to execute trades, critical for HFT where milliseconds matter.
8. Transaction Costs: Includes spreads, commissions, and slippage, impacting overall profitability.
9. Volume: Total shares or contracts traded, reflecting market impact and liquidity.
10. Return on Investment (ROI): Overall profitability relative to the capital invested.
These metrics collectively offer a comprehensive view of HFT performance.
How does liquidity impact high-frequency trading metrics?
Liquidity directly affects high-frequency trading (HFT) metrics by influencing order execution speed, slippage, and spread. Higher liquidity typically leads to tighter spreads and faster execution times, improving profitability. In contrast, low liquidity can cause increased slippage and wider spreads, negatively impacting performance metrics like return on investment (ROI) and trade execution efficiency. HFT strategies rely on liquidity to minimize risks and maximize trades, making it a critical factor in evaluating their effectiveness.
What role does latency play in HFT performance evaluation?
Latency is crucial in high-frequency trading (HFT) performance evaluation as it directly impacts execution speed and market responsiveness. Lower latency allows traders to capitalize on price discrepancies faster than competitors, enhancing profitability. High latency can result in missed opportunities and slippage, where trades execute at less favorable prices. Metrics like round-trip time and order response time help assess latency's effect on trading efficiency and overall performance. Reducing latency is essential for maintaining a competitive edge in HFT.
Which profitability metrics are crucial for HFT analysis?
Key profitability metrics for high-frequency trading (HFT) analysis include:
1. Sharpe Ratio: Measures risk-adjusted returns, comparing excess return to volatility.
2. Sortino Ratio: Similar to Sharpe but focuses on downside risk, highlighting negative volatility.
3. Profit Factor: The ratio of gross profits to gross losses, indicating overall profitability.
4. Return on Investment (ROI): Measures the gain or loss generated relative to the investment cost.
5. Average Trade Profit: The average profit per trade, providing insight into individual trade performance.
6. Win Rate: The percentage of profitable trades compared to total trades, indicating trading strategy effectiveness.
7. Maximum Drawdown: The largest peak-to-trough decline, assessing risk exposure during losing periods.
These metrics help evaluate HFT performance and inform strategic decisions.
How can traders assess risk in high-frequency trading?
Traders can assess risk in high-frequency trading (HFT) by focusing on key metrics like:
1. Value at Risk (VaR): Measures potential loss in value over a defined period, helping to quantify risk exposure.
2. Sharpe Ratio: Evaluates risk-adjusted returns, indicating whether the returns compensate for the risk taken.
3. Maximum Drawdown: Identifies the largest peak-to-trough decline, providing insight into potential losses during adverse market conditions.
4. Volatility: Analyzes the price fluctuations of assets, helping traders gauge the stability of their strategies.
5. Liquidity Metrics: Assess bid-ask spreads and order book depth to understand execution risk and transaction costs.
Using these metrics allows traders to make informed decisions and adjust strategies to manage risk effectively.
What is the significance of order execution quality in HFT?
Order execution quality in high-frequency trading (HFT) is crucial because it directly impacts profitability and risk management. High-quality execution ensures that trades are completed at optimal prices with minimal slippage, enhancing returns. Key metrics include execution speed, fill rates, and transaction costs. Poor execution can lead to missed opportunities and increased losses, while superior execution can improve market impact and overall trading effectiveness. In HFT, every millisecond counts, making execution quality a vital component of performance evaluation.
How do transaction costs affect HFT performance metrics?
Transaction costs significantly impact HFT performance metrics by reducing profit margins and affecting overall profitability. High transaction costs can erode gains from rapid trading strategies, leading to lower return on investment (ROI). Key metrics like Sharpe ratio and alpha may also appear worse when transaction costs are factored in, as they reflect the net returns after costs. Additionally, increased costs can force HFT firms to adjust their strategies, impacting execution speed and liquidity provision. Thus, managing transaction costs is crucial for optimizing HFT performance.
What performance benchmarks are used in high-frequency trading?
Key performance benchmarks in high-frequency trading (HFT) include:
1. Latency: Measures the time it takes to execute trades. Lower latency is crucial for HFT.
2. Throughput: Refers to the number of trades executed per second. Higher throughput indicates better performance.
3. Fill Rate: The percentage of orders that are successfully executed. A higher fill rate shows efficiency.
4. Slippage: The difference between expected trade prices and actual execution prices. Lower slippage is preferred.
5. Return on Investment (ROI): Measures profitability relative to capital invested. Higher ROI indicates better performance.
6. Sharpe Ratio: Assesses risk-adjusted returns. A higher Sharpe ratio suggests a better risk-return profile.
7. Order Book Analysis: Evaluates the depth and liquidity of the market. Strong order book dynamics enhance trading strategies.
These benchmarks help assess the effectiveness and profitability of HFT strategies.
How can backtesting improve HFT performance evaluation?
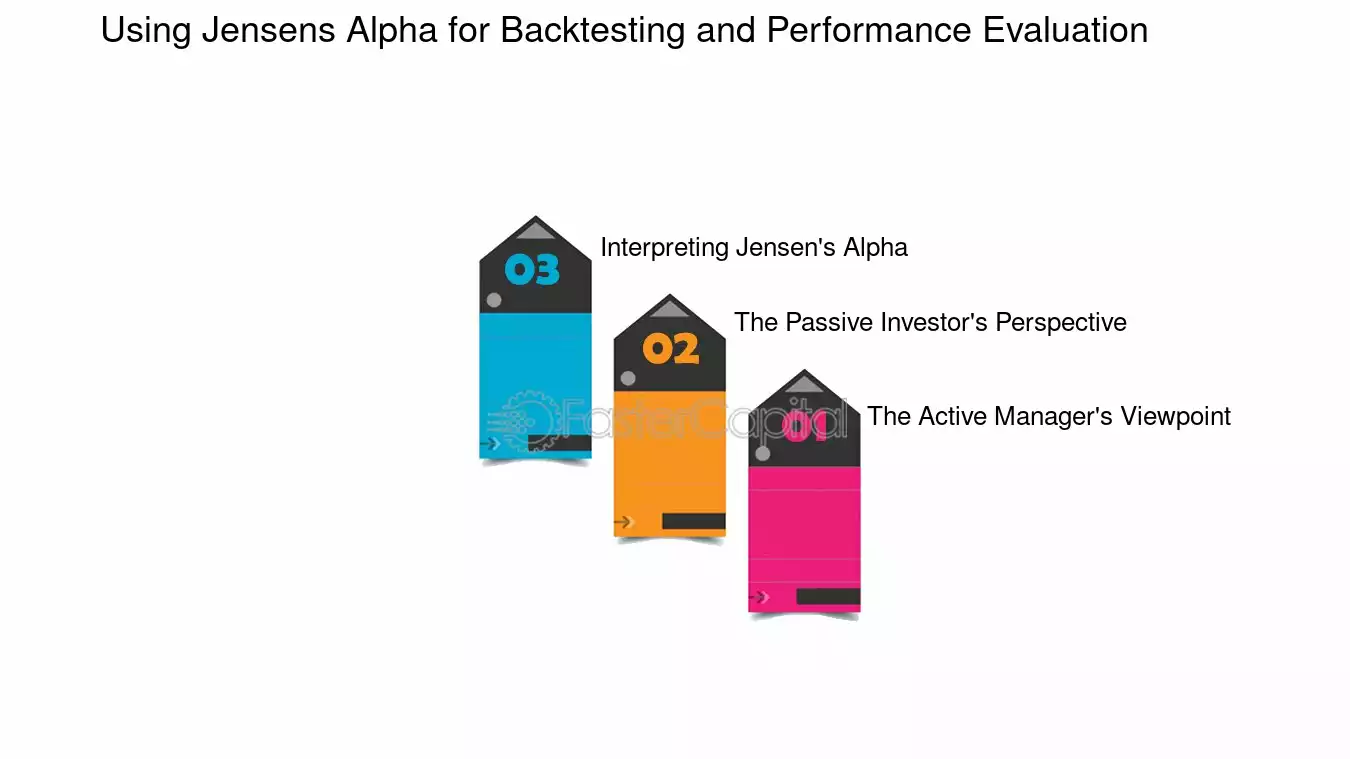
Backtesting enhances HFT performance evaluation by allowing traders to simulate strategies using historical data. It provides insights into strategy effectiveness, risk management, and potential profitability. Key metrics such as Sharpe ratio, maximum drawdown, and win rate can be analyzed to assess performance under various market conditions. Additionally, backtesting helps identify optimal parameters and refine algorithms, leading to improved execution and reduced slippage. Overall, it’s essential for validating strategies before live deployment.
What metrics indicate market impact in high-frequency trading?
Key metrics indicating market impact in high-frequency trading (HFT) include:
1. Volume Impact: Measures how much trading volume affects the stock price.
2. Price Impact: Assesses how HFT orders influence market prices.
3. Latency: The time delay in executing trades; lower latency often means greater market impact.
4. Order-to-Trade Ratio: Compares the number of orders sent to the number of trades executed, reflecting efficiency.
5. Slippage: The difference between expected and executed prices, indicating market impact during execution.
6. Market Depth: Evaluates how much liquidity exists at various price levels, affecting order execution.
7. Spread Metrics: Analyzes bid-ask spreads pre- and post-trade to determine HFT’s effect on liquidity.
These metrics collectively help gauge the effectiveness and influence of HFT strategies on market dynamics.
How do volume metrics relate to HFT success?
Volume metrics are crucial for assessing High-Frequency Trading (HFT) success. High trading volume indicates liquidity, allowing HFT strategies to execute orders quickly and efficiently. Increased volume can also signal market interest, helping HFT firms identify optimal entry and exit points. Additionally, tracking volume can reveal patterns and trends, informing algorithm adjustments. Ultimately, strong volume metrics correlate with enhanced profitability and reduced slippage, key indicators of HFT performance.
What is the importance of win rate in evaluating HFT strategies?
Win rate is crucial in evaluating high-frequency trading (HFT) strategies because it measures the percentage of profitable trades. A higher win rate indicates effectiveness in predicting market movements, which is essential for strategy viability. However, it must be analyzed alongside other metrics, like profit factor and average gain per trade, to provide a complete picture. Ultimately, a balanced win rate contributes to overall profitability and risk management in HFT.
How can Sharpe ratio be applied to high-frequency trading?
The Sharpe ratio can evaluate high-frequency trading (HFT) by measuring risk-adjusted returns. It compares the excess return of an HFT strategy over a risk-free rate to its volatility. A higher Sharpe ratio indicates better performance relative to risk, helping traders assess the effectiveness of their algorithms. By analyzing daily or even intra-day returns, HFT firms can identify which strategies yield the best risk-adjusted returns and optimize their trading approaches accordingly.
What are the key differences between HFT and traditional trading metrics?
Key differences between HFT and traditional trading metrics include:
1. Speed: HFT focuses on execution speed, measuring latency in milliseconds or microseconds, while traditional trading metrics prioritize execution quality over speed.
2. Volume: HFT often involves high trading volumes with numerous short-term trades, whereas traditional trading metrics look at fewer, larger trades.
3. Profit Margins: HFT relies on small profit margins per trade, accumulating gains through volume, unlike traditional trading which seeks larger profits from longer-held positions.
4. Market Impact: HFT strategies often aim to minimize market impact, while traditional trading may accept greater impact due to larger order sizes.
5. Risk Metrics: HFT emphasizes metrics like Sharpe ratio and drawdown in the context of rapid trades, while traditional trading metrics often focus on overall portfolio risk and volatility.
6. Liquidity Provision: HFT strategies frequently include metrics measuring liquidity provision, whereas traditional traders might focus on bid-ask spreads and market depth.
How do slippage and fill rates influence HFT performance?
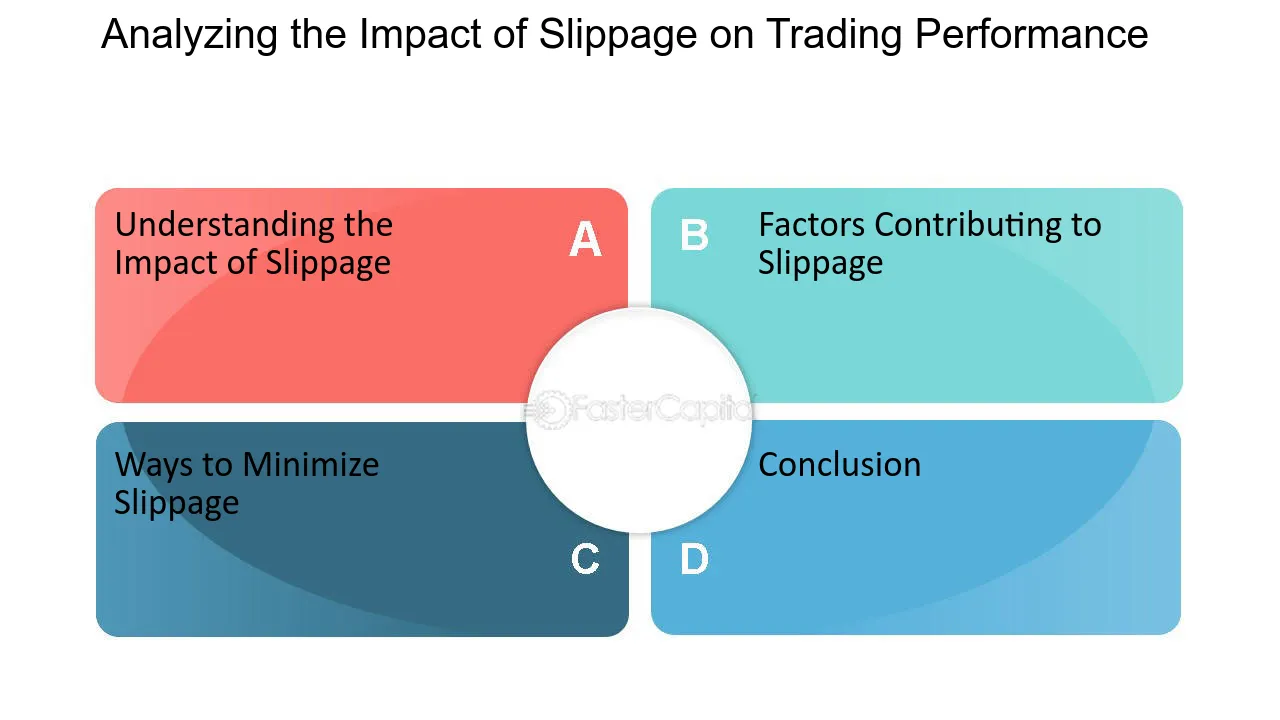
Slippage and fill rates significantly impact high-frequency trading (HFT) performance. Slippage refers to the difference between the expected price of a trade and the actual execution price. High slippage can erode profits, especially in fast-moving markets. Fill rates measure the percentage of orders executed compared to those submitted. Low fill rates indicate that orders are not being executed as intended, leading to missed opportunities and potential losses. Together, these metrics reveal how efficiently an HFT strategy operates. Optimizing for low slippage and high fill rates is crucial for maximizing profitability and maintaining a competitive edge.
What tools are available for tracking HFT performance metrics?
For tracking High-Frequency Trading (HFT) performance metrics, consider these tools:
1. Bloomberg Terminal: Offers comprehensive analytics, real-time data, and performance tracking.
2. QuantConnect: A cloud-based platform for backtesting and analyzing trading algorithms.
3. TradeStation: Provides advanced charting tools and performance metrics for HFT strategies.
4. Kx Systems: Specializes in high-performance databases for real-time analytics in HFT.
5. Tick Data: Supplies historical tick data and analytics for performance evaluation.
6. MetaTrader: Widely used for tracking trades and performance metrics, especially in forex.
7. AlgoTrader: A platform designed for algorithmic trading, focusing on performance measurement.
These tools help analyze key performance indicators like execution speed, slippage, and profitability.
Conclusion about Key Metrics for Evaluating HFT Performance
In high-frequency trading (HFT), understanding key performance metrics is essential for success. Traders must evaluate liquidity, latency, profitability, and risk to optimize their strategies effectively. By focusing on order execution quality and transaction costs, one can gain insights into performance benchmarks. Additionally, metrics like win rate and Sharpe ratio are vital for assessing strategy effectiveness. Utilizing backtesting and monitoring volume metrics can further enhance HFT analysis. For those seeking to refine their trading approach, DayTradingBusiness offers comprehensive resources to navigate these complexities and improve performance.