Did you know that the ancient Japanese used candlestick charts to track rice prices long before day trading became a thing? Fast forward to today, and understanding candlestick patterns is essential for savvy traders. This article dives into the fundamentals of candlestick patterns in day trading, explaining what they are and how they can influence trading decisions. You'll learn about common patterns, effective reading techniques, and the significance of bullish and bearish indicators. We also cover reversal patterns, the impact of timeframes, and the role of volume. Plus, discover how to combine candlestick patterns with other indicators, avoid common mistakes, and find resources for further learning. With DayTradingBusiness, you’ll be equipped to enhance your trading strategy and navigate market conditions like a pro.
What Are Candlestick Patterns in Day Trading?
Candlestick patterns in day trading are visual representations of price movements on a chart, formed by four key components: open, high, low, and close prices. Each candlestick reflects market sentiment over a specific time frame, helping traders identify trends and potential reversals. Common patterns include doji, hammer, engulfing, and shooting star, each signaling different market conditions. Recognizing these patterns aids traders in making informed decisions about entry and exit points.
How Do Candlestick Patterns Help in Trading Decisions?
Candlestick patterns help in trading decisions by visually representing price movements and market sentiment. They indicate potential reversals or continuations in trends. For example, a bullish engulfing pattern suggests buyers may take control, signaling a good entry point for long positions. Conversely, a bearish engulfing indicates selling pressure, which can prompt traders to exit or short. Recognizing these patterns allows traders to make informed decisions based on price action, improving timing and risk management in day trading.
What Are the Most Common Candlestick Patterns?
The most common candlestick patterns in day trading include:
1. Doji: Indicates indecision in the market.
2. Hammer: A bullish reversal pattern occurring after a downtrend.
3. Shooting Star: A bearish reversal pattern appearing after an uptrend.
4. Engulfing: A strong reversal signal where one candle fully engulfs the previous one.
5. Morning Star: A bullish reversal pattern consisting of three candles.
6. Evening Star: A bearish reversal pattern with three candles.
7. Bullish/Bearish Harami: A two-candle pattern signaling potential reversals.
These patterns help traders identify potential market reversals and continuations.
How to Read Candlestick Patterns Effectively?
To read candlestick patterns effectively in day trading, focus on these key steps:
1. Identify Patterns: Learn common patterns like doji, engulfing, and hammer. Recognize what they signal about market sentiment.
2. Context Matters: Always consider the trend. Patterns in an uptrend may indicate continuation, while in a downtrend, they may suggest reversal.
3. Volume Confirmation: Check trading volume alongside patterns. Higher volume can validate the strength of the signal.
4. Time Frames: Use multiple time frames. A pattern on a daily chart might look different on a 1-minute chart.
5. Combine with Other Indicators: Use candlestick patterns with other technical indicators like moving averages or RSI for better accuracy.
6. Practice Regularly: Analyze historical charts. The more you practice, the better you’ll interpret patterns in real-time.
7. Stay Updated: Market conditions change, so keep learning about new patterns and strategies.
By focusing on these steps, you’ll improve your ability to read candlestick patterns effectively in day trading.
What Do Bullish and Bearish Candlestick Patterns Indicate?
Bullish candlestick patterns indicate potential upward price movement, suggesting buying pressure. Examples include the hammer and engulfing patterns, which can signal a reversal from a downtrend.
Bearish candlestick patterns indicate potential downward price movement, reflecting selling pressure. Patterns like the shooting star and bearish engulfing suggest a reversal from an uptrend.
Traders use these patterns to make informed decisions about entering or exiting trades based on market sentiment.
How Can I Identify Reversal Candlestick Patterns?
To identify reversal candlestick patterns in day trading, look for specific formations at the end of a trend. Key patterns include:
1. Hammer: A small body at the top with a long lower shadow, indicating potential bullish reversal after a downtrend.
2. Shooting Star: A small body at the bottom with a long upper shadow, signaling a possible bearish reversal after an uptrend.
3. Engulfing: A larger candle that completely engulfs the previous smaller candle, suggesting a strong reversal in the opposite direction.
4. Doji: A candle with a small body and long shadows, indicating indecision; if it appears after a trend, it may suggest a reversal.
5. Morning Star: A three-candle pattern with a downtrend, a small body, and a subsequent bullish candle, indicating a potential uptrend.
Watch for confirmation with volume and subsequent price action to enhance reliability.
What Is the Significance of Candlestick Wicks?
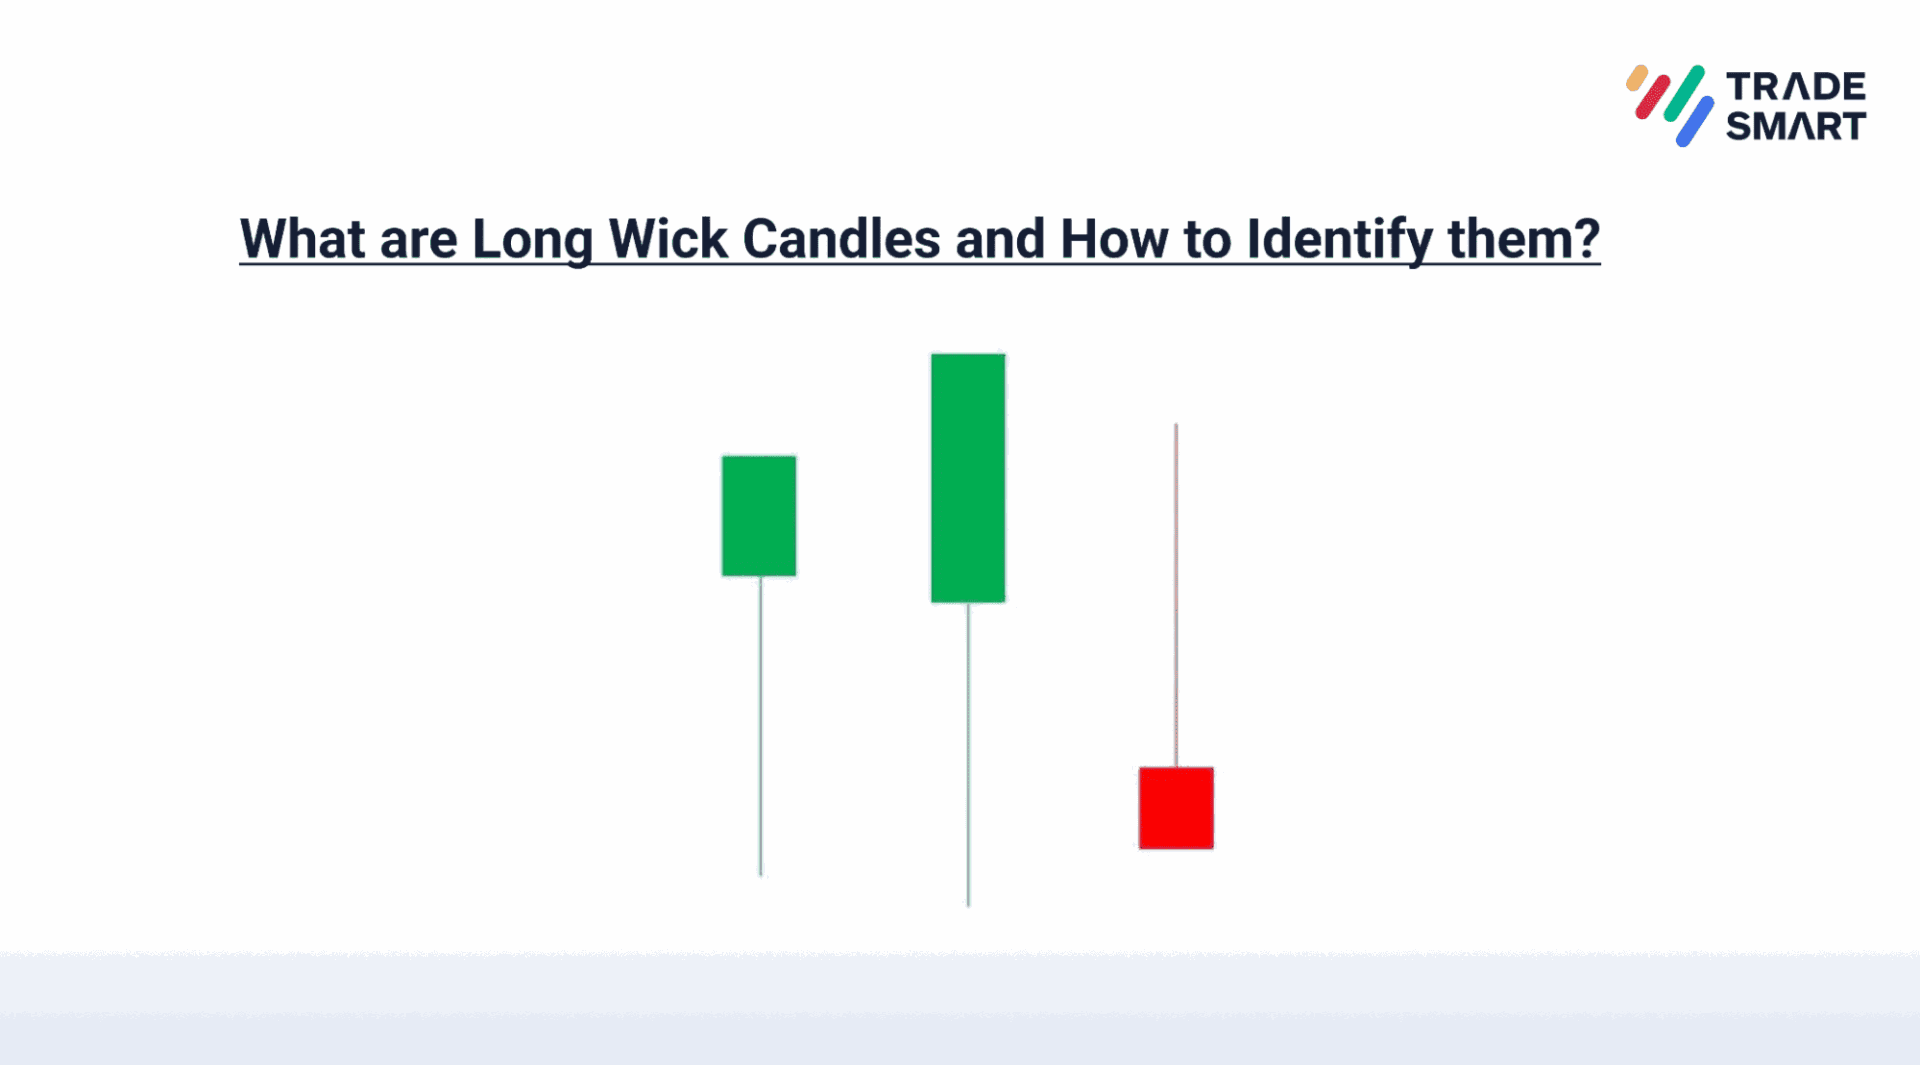
Candlestick wicks show the high and low prices during a trading session, indicating market volatility and potential reversal points. A long upper wick suggests sellers pushed prices down after a high, signaling weakness in buying pressure. Conversely, a long lower wick indicates buyers stepped in after a low, suggesting support. Analyzing wicks helps traders identify trends, strength, and possible entry or exit points in day trading.
How Do Timeframes Affect Candlestick Patterns?
Timeframes significantly influence candlestick patterns in day trading. Shorter timeframes, like 1-minute or 5-minute charts, often produce more volatile and erratic patterns, reflecting quick market sentiment changes. In contrast, longer timeframes, such as daily or weekly charts, reveal more stable and reliable patterns, providing clearer insights into overall market trends.
Traders may interpret the same candlestick pattern differently based on the timeframe. For example, a bullish engulfing pattern on a daily chart suggests a strong reversal, while on a 5-minute chart, it might indicate a brief price bounce. Thus, selecting the right timeframe is crucial for accurate analysis and trading decisions.
What Role Do Volume and Candlestick Patterns Play?
Volume and candlestick patterns are crucial in day trading because they provide insights into market strength and price movements. High volume accompanying a candlestick pattern signals strong conviction behind the price action, increasing the likelihood of a trend continuation or reversal. For example, a bullish engulfing pattern with high volume suggests strong buying interest, while a bearish reversal pattern with elevated volume indicates selling pressure. Traders often use this combination to confirm signals and make informed decisions, enhancing their chances of successful trades.
How to Use Candlestick Patterns with Other Indicators?
To use candlestick patterns effectively with other indicators in day trading, first identify key candlestick formations like dojis, hammers, or engulfing patterns. Then, confirm these patterns with indicators such as moving averages, RSI, or MACD. For example, if a bullish engulfing pattern appears, check if the RSI is below 30 for added confirmation of an oversold condition. Combine these insights to make informed entry or exit decisions. Always consider the overall market trend and volume for additional context.
What Are Candlestick Patterns for Beginners?
Candlestick patterns are visual indicators used in day trading to predict price movements based on historical data. For beginners, key patterns include:
1. Doji: Indicates indecision in the market; the opening and closing prices are nearly the same.
2. Hammer: A bullish reversal pattern showing potential upward movement after a downtrend.
3. Shooting Star: A bearish reversal pattern signaling a potential decline after an uptrend.
4. Bullish Engulfing: A strong buying signal where a larger bullish candle engulfs a smaller bearish one.
5. Bearish Engulfing: A selling signal where a larger bearish candle engulfs a smaller bullish one.
Understanding these patterns helps traders make informed decisions based on market sentiment.
How to Trade Using Candlestick Patterns?
To trade using candlestick patterns, first, familiarize yourself with common patterns like dojis, hammers, and engulfing candles. Look for these patterns at key support and resistance levels, as they often indicate potential reversals or continuations in price trends.
When a bullish pattern appears after a downtrend, consider entering a long position; for bearish patterns after an uptrend, look to sell or short. Confirm signals with volume; higher volume increases reliability. Always have a stop-loss in place to manage risk. Analyze patterns in conjunction with other indicators for better decision-making.
What Mistakes Should I Avoid with Candlestick Patterns?
Avoid these mistakes with candlestick patterns in day trading:
1. Ignoring Context: Don't analyze patterns in isolation; always consider the overall market trend and volume.
2. Overtrading: Don't act on every pattern; wait for confirmation signals before entering trades.
3. Neglecting Timeframes: Avoid relying solely on one timeframe; check multiple timeframes for better accuracy.
4. Misinterpreting Patterns: Ensure you understand the specific candlestick formations; misreading them can lead to poor decisions.
5. Lack of Risk Management: Never trade without setting stop-loss orders; protect your capital against unexpected moves.
6. Chasing Trends: Avoid entering trades late; stick to your strategy and don’t jump in just because a pattern appears.
7. Ignoring Market Sentiment: Don't overlook news and events that could affect price action; they can invalidate patterns.
By steering clear of these pitfalls, you can use candlestick patterns more effectively in your day trading strategy.
How to Practice Identifying Candlestick Patterns?
To practice identifying candlestick patterns in day trading, start by studying a variety of patterns like dojis, hammers, and engulfing patterns. Use charting software to analyze historical price charts and mark patterns as you find them. Set aside time daily to review charts, focusing on different time frames. Join trading communities or forums to discuss patterns with others. Additionally, consider using simulation platforms to trade based on your pattern recognition skills without financial risk. Regular practice will enhance your ability to spot patterns quickly and accurately.
What Resources Are Available for Learning Candlestick Patterns?
To learn candlestick patterns in day trading, use these resources:
1. Books: "Japanese Candlestick Charting Techniques" by Steve Nison is a classic.
2. Online Courses: Websites like Udemy and Coursera offer courses specifically on candlestick patterns.
3. YouTube: Channels like Rayner Teo and Trading 212 provide visual explanations and examples.
4. Trading Platforms: Many platforms like ThinkorSwim and TradingView have built-in educational tools and pattern recognition features.
5. Forums: Join communities on Reddit or TradingView to discuss and analyze candlestick patterns with other traders.
6. Mobile Apps: Apps like Stock Chart and Investopedia offer quick references and practice tools.
These resources can enhance your understanding and application of candlestick patterns in day trading.
How Do Market Conditions Impact Candlestick Patterns?
Market conditions significantly influence candlestick patterns by affecting their formation and interpretation. In a bullish market, patterns like bullish engulfing or hammer indicate strong buying interest, often leading to upward price movements. Conversely, in a bearish market, patterns such as shooting stars or bearish engulfing signal selling pressure, suggesting potential declines.
Volatility also plays a role; high volatility can create erratic candlestick patterns that may mislead traders, while low volatility often results in clearer, more reliable signals. Overall, understanding the market context enhances the effectiveness of candlestick patterns in day trading.
Conclusion about Understanding Candlestick Patterns in Day Trading
In summary, mastering candlestick patterns is essential for informed day trading. These patterns not only provide insights into market sentiment but also enhance decision-making when combined with other technical indicators. Understanding the nuances of bullish and bearish formations can significantly improve trading outcomes. For those looking to deepen their knowledge and skills in this area, resources from DayTradingBusiness offer valuable guidance and support.
Learn about Understanding Candlestick Patterns in Day Trading