Did you know that even the best traders sometimes flip a coin to make decisions? While it might not be the best strategy, understanding technical analysis is crucial for informed trading decisions. This article dives into the essentials of technical analysis in day trading, covering everything from reading stock charts and key indicators to the significance of volume and support levels. You'll learn how to effectively use moving averages, trendlines, and candlestick patterns, as well as the importance of setting stop loss and take profit levels. Additionally, we’ll discuss common mistakes to avoid and how to enhance your technical analysis skills. With insights from DayTradingBusiness, you'll be equipped to develop a robust trading plan that maximizes your day trading success.
What is Technical Analysis in Day Trading?
Technical analysis in day trading involves examining price charts and patterns to predict future price movements. To perform it, start by selecting a trading platform with charting tools. Use indicators like moving averages, Relative Strength Index (RSI), and Bollinger Bands to identify trends and entry/exit points. Analyze candlestick patterns for market sentiment and support/resistance levels to determine potential price reversals. Monitor volume to confirm trends and ensure your trades align with market momentum. Always combine technical analysis with risk management strategies to protect your capital.
How Do I Read Stock Charts for Day Trading?
To read stock charts for day trading, start by identifying key elements like the price trend, volume, and candlestick patterns. Look for support and resistance levels that indicate potential price reversals. Use indicators like moving averages and RSI (Relative Strength Index) to gauge momentum. Track volume spikes to confirm trends. Analyze timeframes; shorter ones (like 5 or 15 minutes) are ideal for day trading. Finally, practice with a demo account to refine your skills without risk.
What Are Key Indicators for Day Trading?
Key indicators for day trading include:
1. Moving Averages: Use short-term averages (like the 9 or 21-day) to identify trends.
2. Relative Strength Index (RSI): Indicates overbought or oversold conditions; look for levels above 70 or below 30.
3. MACD (Moving Average Convergence Divergence): Helps spot momentum shifts; watch for crossovers.
4. Bollinger Bands: Show volatility and potential price reversals; prices touching bands can signal trades.
5. Volume: High trading volume confirms trends and signals potential reversals or breakouts.
6. Fibonacci Retracement Levels: Identify potential support and resistance levels during price corrections.
Use these indicators to make informed decisions and enhance your technical analysis in day trading.
How Can I Use Moving Averages in Day Trading?
To use moving averages in day trading, follow these steps:
1. Choose the Right Type: Use simple moving averages (SMA) for trend direction or exponential moving averages (EMA) for more responsiveness to price changes.
2. Select Time Frames: Common day trading periods include the 5-minute, 15-minute, or 1-hour charts. Use shorter time frames for quick trades.
3. Identify Trends: Look for crossovers. When a shorter-term moving average crosses above a longer-term moving average, it signals a potential buy. The opposite indicates a sell.
4. Support and Resistance: Use moving averages as dynamic support and resistance levels. Prices often bounce off these lines.
5. Combine with Other Indicators: Enhance your strategy by pairing moving averages with indicators like RSI or MACD for confirmation of signals.
6. Set Entry and Exit Points: Define specific entry and exit points based on moving average signals to minimize emotional decision-making.
7. Monitor Volume: Ensure that trades align with volume patterns, confirming the strength of the signals from moving averages.
Implement these techniques consistently to improve your day trading performance using moving averages.
What Is the Importance of Volume in Day Trading?
Volume in day trading is crucial because it indicates the strength of a price move. High volume often signals strong interest and can confirm trends, while low volume may suggest weak moves that could reverse. Analyzing volume alongside price action helps traders identify potential entry and exit points, enhancing decision-making. For example, if a stock breaks resistance on high volume, it's more likely to continue upward. Conversely, a price increase on low volume might be a sign to be cautious. Ultimately, volume analysis aids in validating trades and managing risk effectively.
How Do I Identify Support and Resistance Levels?
To identify support and resistance levels in day trading, start by looking at historical price charts. Focus on areas where the price has reversed multiple times; these are potential support (price floor) and resistance (price ceiling) levels. Use horizontal lines to mark these points.
Look for psychological levels, like round numbers (e.g., $50, $100), as they often act as support or resistance. Additionally, consider using technical indicators, such as moving averages, which can also indicate these levels. Volume analysis can help confirm these areas; high trading volume at a price level suggests strong support or resistance.
Finally, keep an eye on trends and price action; if the price consistently bounces off a level, it’s likely a solid support or resistance point.
What Patterns Should I Look for in Day Trading?
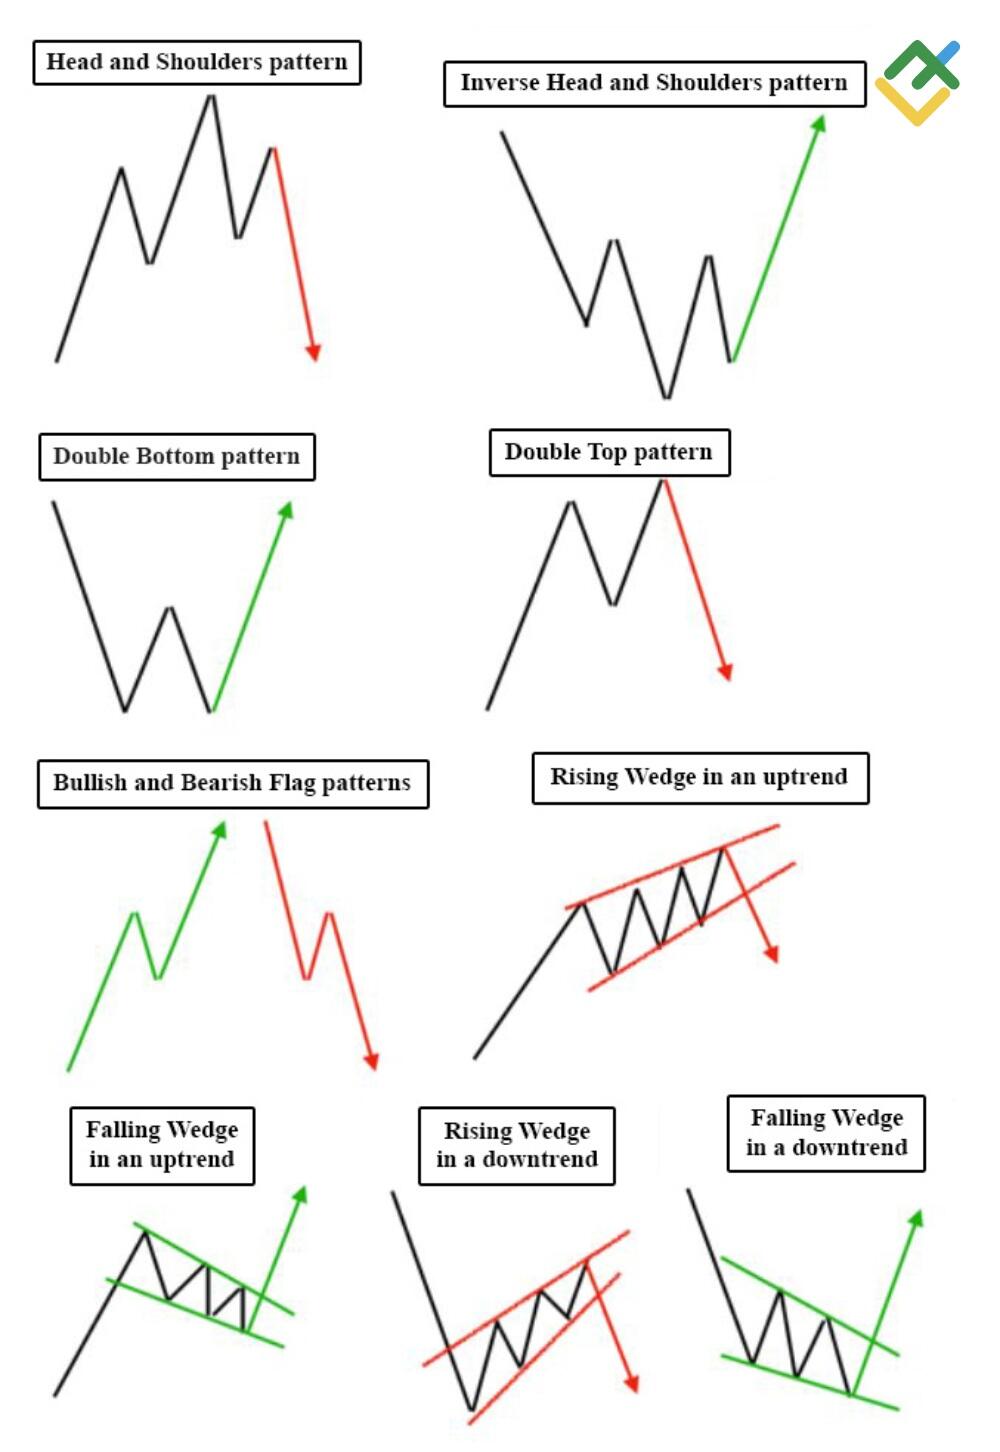
Look for trends, support and resistance levels, and chart patterns like head and shoulders or triangles. Pay attention to moving averages for trend direction and use volume to confirm price movements. Watch for candlestick patterns, such as dojis or engulfing patterns, which can signal reversals. Also, consider indicators like RSI or MACD to gauge momentum and overbought or oversold conditions.
How Do Candlestick Patterns Impact Day Trading Decisions?
Candlestick patterns provide visual insights into market sentiment and potential price movements, significantly impacting day trading decisions. Traders analyze these patterns to identify trends, reversals, and entry or exit points. For example, a bullish engulfing pattern may signal a buying opportunity, while a bearish engulfing pattern could indicate a sell signal. Recognizing patterns like dojis, hammers, or shooting stars helps traders gauge market momentum and volatility, allowing for more informed and timely trades. Integrating candlestick analysis with other technical indicators enhances decision-making and risk management in day trading.
What Is the Role of Trendlines in Day Trading?
Trendlines in day trading help identify the direction of price movement, acting as visual indicators for support and resistance levels. Traders use upward trendlines to spot bullish trends, while downward trendlines highlight bearish trends. By connecting significant price points, trendlines assist in making informed entry and exit decisions. They also aid in predicting potential reversals or continuations in price patterns, enhancing risk management. In technical analysis, incorporating trendlines allows traders to gauge market sentiment and adjust strategies accordingly.
How Can I Use RSI for Day Trading Strategies?
To use the Relative Strength Index (RSI) for day trading, follow these steps:
1. Identify Overbought and Oversold Levels: Generally, an RSI above 70 indicates overbought conditions, while below 30 signals oversold conditions.
2. Look for Divergences: If the price moves in the opposite direction of the RSI, it may indicate a potential reversal. For example, if prices rise but the RSI falls, consider selling.
3. Combine with Other Indicators: Use RSI alongside moving averages or support and resistance levels for confirmation. This helps validate entry and exit points.
4. Set Entry and Exit Points: Enter trades when the RSI crosses above 30 (buy) or below 70 (sell), ensuring you have clear targets based on volatility and market conditions.
5. Monitor Timeframes: Focus on shorter timeframes, like 5-minute or 15-minute charts, to spot quick trading opportunities.
6. Adjust for Market Conditions: Adapt your RSI settings (e.g., using a 9-period instead of the standard 14) based on the asset's volatility and your trading style.
Implement these steps to effectively integrate RSI into your day trading strategies.
Learn about How Do Prop Firms Affect Day Trading Strategies?
What Are the Best Time Frames for Day Trading Analysis?
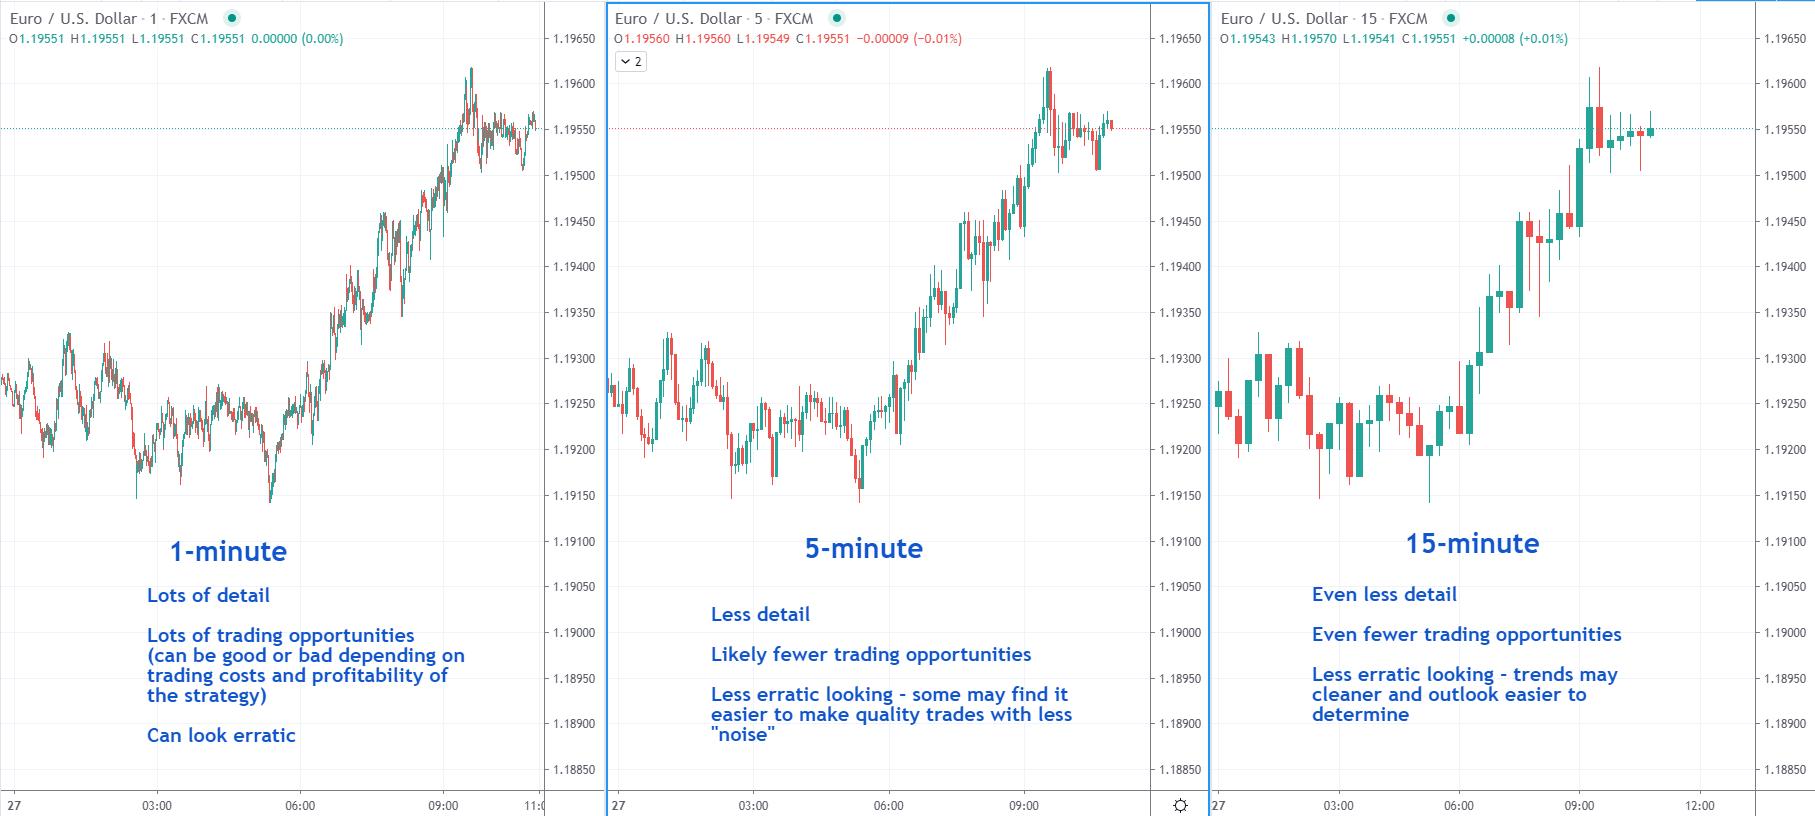
The best time frames for day trading analysis typically include 1-minute, 5-minute, and 15-minute charts. These shorter time frames allow for quick entry and exit opportunities. Many traders also use the 30-minute and hourly charts for trend confirmation and broader market context. Combining multiple time frames can enhance your analysis, helping you spot potential trades more effectively.
Learn about What Are the Best Tools for Day Trading Analysis?
How Do I Set Stop Loss and Take Profit Levels?
To set stop loss and take profit levels in day trading, first determine your entry point. Use technical analysis to identify support and resistance levels. For a stop loss, place it below the nearest support level if buying, or above resistance if selling. A common strategy is to risk 1-2% of your trading capital. For take profit, set it at a level that offers a favorable risk-reward ratio, typically 2:1 or higher. Monitor the trade and adjust levels based on market movements.
What Tools Can Help Me with Day Trading Technical Analysis?
To perform technical analysis in day trading, use these tools:
1. Charting Software: Platforms like TradingView or MetaTrader provide advanced charting capabilities with various indicators.
2. Technical Indicators: Utilize moving averages, RSI, MACD, and Bollinger Bands to identify trends and potential reversals.
3. Stock Scanners: Tools like Finviz or Trade Ideas help filter stocks based on technical criteria like volume and price movements.
4. News Aggregators: Stay updated with real-time news using services like Benzinga or MarketWatch to understand market sentiment.
5. Backtesting Software: Use platforms like NinjaTrader or Amibroker to test strategies against historical data.
6. Order Flow Tools: Consider tools like Bookmap or Jigsaw Trading to analyze market depth and order flow for better trade execution.
These tools streamline your technical analysis process and enhance decision-making in day trading.
Learn about What Are the Best Tools for Day Trading Analysis?
How Do I Develop a Trading Plan Using Technical Analysis?
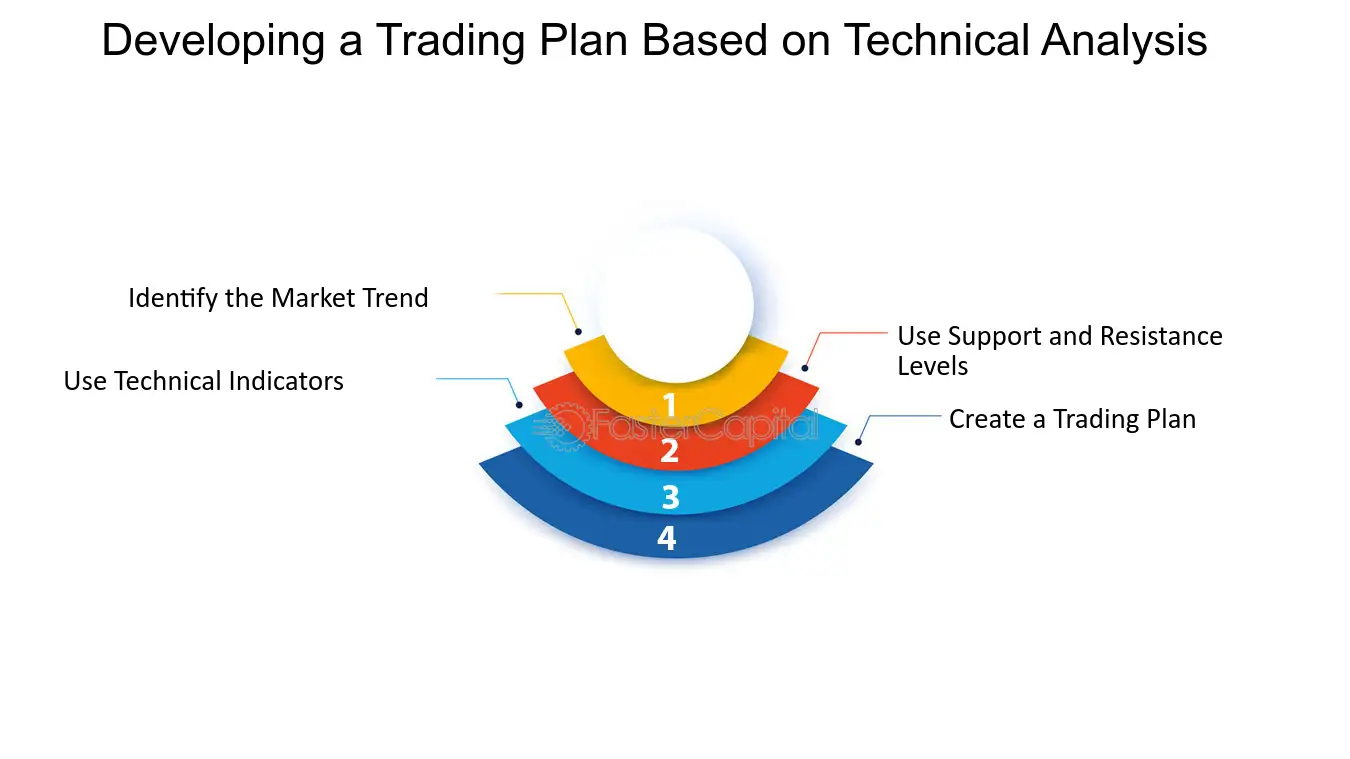
To develop a trading plan using technical analysis for day trading, follow these steps:
1. Define Your Goals: Set clear profit targets and risk tolerance levels.
2. Choose Your Markets: Select the stocks, forex pairs, or commodities you want to trade.
3. Select Indicators: Pick a few key technical indicators (like moving averages, RSI, or MACD) that align with your trading strategy.
4. Create Entry and Exit Rules: Specify conditions for entering and exiting trades based on your indicators.
5. Risk Management: Decide how much capital to risk on each trade. Typically, risk 1-2% of your trading account.
6. Backtest Your Strategy: Use historical data to see how your plan would have performed.
7. Keep a Trading Journal: Document your trades to analyze what works and what doesn’t.
8. Review and Adjust: Regularly evaluate your performance and adjust your plan as needed.
Implementing these steps will help you create a robust trading plan focused on technical analysis.
Learn about How to Develop a Technical Analysis Trading Plan
What Common Mistakes Should I Avoid in Day Trading Technical Analysis?
Avoid these common mistakes in day trading technical analysis:
1. Ignoring Volume: Don’t just focus on price; analyze volume to confirm trends and reversals.
2. Overcomplicating Charts: Keep your charts simple. Too many indicators can lead to confusion.
3. Chasing Losses: Don’t make impulsive trades to recover losses. Stick to your strategy.
4. Neglecting Risk Management: Always set stop-loss orders to protect your capital.
5. Failing to Adapt: Market conditions change; be flexible and adjust your analysis accordingly.
6. Overtrading: Avoid taking too many trades in a short period. Quality over quantity matters.
7. Ignoring News Events: Major news can impact price movements; stay informed about market-affecting events.
8. Not Backtesting Strategies: Test your strategies on historical data before applying them in live trading.
Stay disciplined and focused on these aspects to improve your day trading outcomes.
Learn about Common Mistakes in Day Trading Analysis to Avoid
How Can I Improve My Technical Analysis Skills for Day Trading?
To improve your technical analysis skills for day trading, start by mastering the basics of chart patterns, support and resistance levels, and key indicators like moving averages and RSI. Practice analyzing charts daily to recognize trends and signals. Use trading simulators to apply your skills in real-time without financial risk. Study successful traders and their strategies, and consider joining trading communities for feedback. Regularly review your trades to learn from mistakes and refine your approach. Lastly, stay updated on market news that might affect your technical analysis.
Learn about How to Improve Your Day Trading Analysis Skills
Conclusion about How to Perform Technical Analysis in Day Trading
In conclusion, mastering technical analysis is crucial for successful day trading. By understanding stock charts, key indicators, and patterns, traders can make informed decisions that enhance their profitability. Utilizing tools like moving averages, RSI, and volume analysis further strengthens your strategies. Avoid common pitfalls and continually refine your skills to stay ahead in the market. DayTradingBusiness is here to support you on your journey to becoming a proficient trader.
Learn about How to Combine Fundamental and Technical Analysis in Day Trading