Did you know that even the best traders sometimes get it wrong, like the time a trader mistook a cat video for a market analysis? In the world of trading, timing is everything, especially when it comes to reversal trading. This article dives deep into the nuances of reversal trading, detailing what it is and how it functions. You'll learn the optimal moments for executing reversal trades, how to spot key reversal patterns in price charts, and the importance of market sentiment. We also cover essential indicators, common mistakes to avoid, and the role of support and resistance levels. Discover how candlestick patterns and economic news impact your trades and explore effective strategies for managing risk. With insights on the best timeframes and tools for timing your trades, this guide from DayTradingBusiness equips you with the knowledge to enhance your trading skills and make informed decisions.
What is Reversal Trading and How Does It Work?
Reversal trading involves identifying price trend changes to capitalize on potential market reversals. Traders look for signs that a trend is losing momentum, such as candlestick patterns, support and resistance levels, or indicators like RSI.
To execute a reversal trade, one typically waits for confirmation—like a breakout from a trend line or a significant price level being breached. Once confirmed, traders enter positions opposite to the prevailing trend, aiming for a profit as prices shift direction. Risk management is crucial, often using stop-loss orders to minimize potential losses. This strategy requires keen market analysis and timing to be effective.
When is the Best Time to Execute a Reversal Trade?
The best time to execute a reversal trade is when you see clear signs of market exhaustion, such as overbought or oversold conditions indicated by technical indicators like RSI or MACD. Look for price action patterns, like double tops or bottoms, and confirmation through increased volume. Ideally, enter the trade after a reversal candle forms, signaling a potential shift in momentum. Timing is crucial; act swiftly after these signals to maximize your potential gains.
How Can You Identify Reversal Patterns in Price Charts?
To identify reversal patterns in price charts, look for key formations like head and shoulders, double tops, or double bottoms. Analyze volume trends; increasing volume with a reversal pattern often signals strength. Use candlestick patterns, such as hammers or engulfing patterns, to confirm potential reversals. Check for divergence between price and indicators like RSI or MACD, which can highlight weakening momentum. Lastly, consider support and resistance levels; a price hitting these zones can indicate a potential reversal.
What Indicators Help Spot Potential Reversals in the Market?
Key indicators to spot potential market reversals include:
1. Candlestick Patterns: Look for formations like hammers, shooting stars, or engulfing patterns.
2. Relative Strength Index (RSI): An RSI above 70 indicates overbought conditions, while below 30 signals oversold conditions.
3. Moving Averages: Crossovers, especially between short-term and long-term moving averages, can signal reversals.
4. Support and Resistance Levels: Price bouncing off established support or resistance often indicates a potential reversal.
5. MACD (Moving Average Convergence Divergence): Look for signal line crossovers or divergence from price movements.
6. Volume Spikes: Increased trading volume during a price change can confirm reversal signals.
Use these indicators together for better accuracy in timing your trades.
How Does Market Sentiment Influence Reversal Trading Timing?
Market sentiment significantly impacts reversal trading timing. When sentiment is overly bullish, it may indicate an impending downturn, prompting traders to consider short positions. Conversely, extreme bearish sentiment can signal a potential upward reversal, encouraging long positions.
Traders often look for sentiment indicators, such as social media trends or news headlines, to gauge market mood. A rapid shift in sentiment can lead to price reversals, so timing your trades around these shifts is crucial. For instance, if sentiment turns negative after a strong rally, a reversal may be imminent, making it a strategic time to enter a short trade.
Understanding sentiment helps traders anticipate market movements and refine their entry and exit points in reversal trading.
What Are the Common Mistakes to Avoid in Reversal Trading?
Common mistakes to avoid in reversal trading include:
1. Ignoring Market Context: Failing to consider overall market trends can lead to entering trades too early.
2. Poor Timing: Entering positions without confirming a reversal pattern can result in losses. Wait for clear signals.
3. Overtrading: Taking too many trades in quick succession often leads to emotional decisions. Stick to a plan.
4. Neglecting Risk Management: Not setting stop-loss orders can amplify losses. Always define your risk.
5. Chasing Moves: Jumping into trades after they’ve already reversed can lead to missed opportunities. Be patient.
6. Focusing Solely on Indicators: Relying only on technical indicators without considering price action can misguide decisions.
7. Ignoring Volume: Not paying attention to volume during reversals can cause misinterpretation of strength. Higher volume often confirms a reversal.
8. Lack of a Trading Plan: Entering trades without a defined strategy can lead to inconsistent results. Have a clear plan in place.
Avoid these pitfalls to enhance your success in reversal trading.
How Can You Use Support and Resistance Levels for Timing Reversals?
To use support and resistance levels for timing reversals, first identify key levels on the chart where price has historically reversed. When the price approaches a support level, look for bullish reversal signals like candlestick patterns or increased volume. Conversely, at resistance levels, watch for bearish signals. Confirm reversals with indicators like RSI or MACD for added reliability. Enter trades when price shows clear signs of reversal, ensuring you set stop-loss orders just beyond the support or resistance levels to manage risk effectively.
What Role Do Candlestick Patterns Play in Reversal Trading?
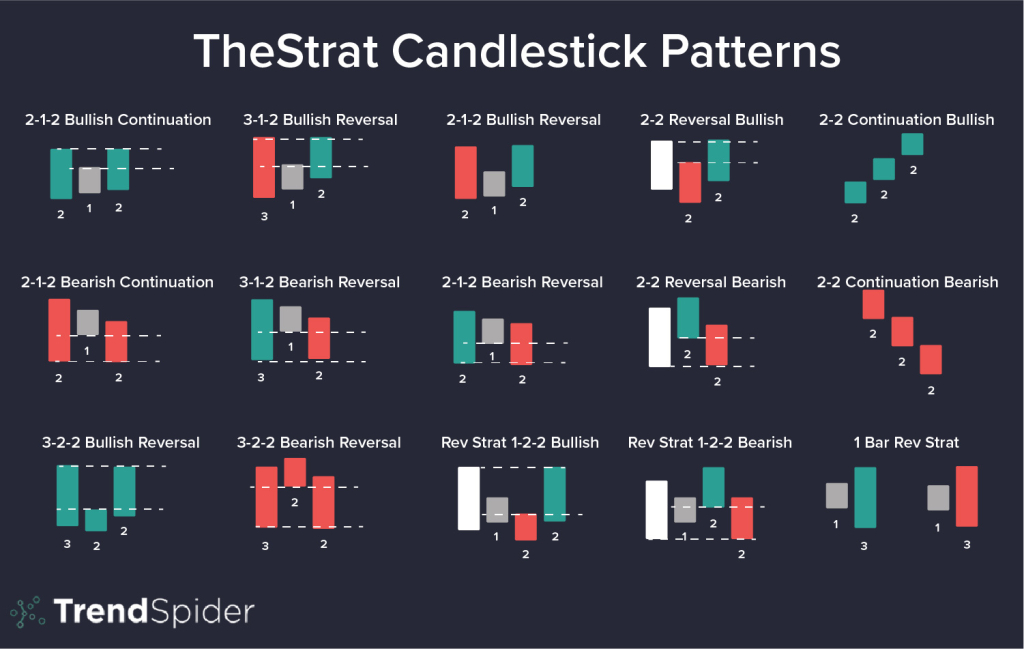
Candlestick patterns are crucial in reversal trading as they signal potential trend changes. Patterns like the hammer, engulfing, and shooting star indicate shifts in market sentiment. Traders use these formations to identify entry and exit points, enhancing timing for trades. Recognizing these patterns helps in predicting reversals, allowing for more strategic decisions and risk management.
How Do Economic News Releases Affect Reversal Trade Timing?
Economic news releases can significantly impact reversal trade timing by influencing market sentiment and volatility. Positive news may lead to overbuying, creating a potential reversal opportunity as traders take profits. Conversely, negative news can trigger panic selling, prompting a reversal as prices drop to attractive levels for buyers. Traders should monitor economic indicators closely; unexpected results often cause sharp price movements, ideal for timing reversals. Analyzing historical reactions to similar news can also enhance your timing strategy.
What Are the Key Strategies for Successful Reversal Trading?
Key strategies for successful reversal trading include:
1. Identify Trend Changes: Look for signs of trend fatigue, such as lower highs in an uptrend or higher lows in a downtrend.
2. Use Technical Indicators: Utilize tools like RSI or MACD to spot overbought or oversold conditions that signal potential reversals.
3. Candlestick Patterns: Watch for reversal patterns like doji, hammer, or engulfing candles as they indicate shifts in market sentiment.
4. Volume Analysis: Confirm reversals with increased volume, indicating strong participation and conviction in the move.
5. Set Stop-Loss Orders: Protect your capital by placing stop-loss orders just beyond recent highs or lows to manage risk effectively.
6. Wait for Confirmation: Don’t jump in too early; wait for a clear confirmation of the reversal before entering a trade.
7. Market Sentiment: Gauge overall market sentiment and news that can influence reversals, ensuring your trades align with broader market trends.
Using these strategies can enhance your success in reversal trading.
How Can You Manage Risk When Timing Reversal Trades?
To manage risk when timing reversal trades, start with a clear entry and exit strategy. Use stop-loss orders to limit potential losses. Analyze price action and key support/resistance levels to identify optimal entry points. Diversify your trades to spread risk. Keep position sizes small relative to your overall capital. Regularly review your trades to learn from mistakes and adjust your strategy as needed. Consider using technical indicators like RSI or MACD to confirm reversal signals before entering a trade.
Learn about How to manage leverage risk when day trading?
What Timeframes Are Best for Reversal Trading?
For reversal trading, the best timeframes are typically the daily and 4-hour charts. These provide a clear view of price action and can reveal significant reversal patterns. Look for key support and resistance levels on these timeframes. Additionally, the 1-hour chart can be useful for fine-tuning entries after identifying reversals on higher timeframes.
How Does Volume Impact the Timing of Reversal Trades?
Volume significantly influences the timing of reversal trades by confirming price movements. High volume during a price reversal signals strong interest and increases the likelihood of a sustained trend change. Conversely, low volume may indicate a lack of conviction, making the reversal less reliable. Traders often look for volume spikes as a key indicator to time their entries and exits effectively. For example, if a stock reverses direction on a notable volume increase, it may be the ideal moment to enter a trade, as it suggests that the new trend is gaining traction.
What Tools and Software Can Assist in Timing Reversal Trades?
To assist in timing reversal trades, consider using these tools and software:
1. Charting Platforms: TradingView and MetaTrader offer advanced charting features to identify potential reversal patterns.
2. Technical Indicators: Utilize indicators like RSI (Relative Strength Index) and MACD (Moving Average Convergence Divergence) to spot overbought or oversold conditions.
3. News Aggregators: Tools like Finviz or Bloomberg provide real-time news that can trigger reversal opportunities based on market sentiment shifts.
4. Automated Trading Systems: Platforms like TradeStation or NinjaTrader allow for automated strategies that can execute trades based on predefined reversal criteria.
5. Backtesting Tools: Use software like Amibroker to backtest reversal strategies, ensuring they have historically performed well.
6. Sentiment Analysis Tools: Services like MarketPsych analyze market sentiment, helping you gauge potential reversals based on trader psychology.
These tools can enhance your ability to time reversal trades effectively.
How Do Different Market Conditions Affect Reversal Trading Timing?
Different market conditions significantly impact reversal trading timing. In a bullish market, reversals may take longer to form as trends are strong; traders often wait for clear signals like candlestick patterns or indicators diverging from price. In contrast, bearish markets might present quicker reversal opportunities due to heightened volatility. Economic news, earnings reports, or geopolitical events can also accelerate reversals, prompting traders to act swiftly. Overall, understanding the market context is crucial for timing your trades effectively in reversal trading.
Learn about How Does Market Microstructure Affect Day Trading Strategies?
How Can You Effectively Time Your Trades Using Day Trading Reversal Strategies?
To time your trades effectively in reversal trading, look for key indicators such as price action, support and resistance levels, and volume spikes. Use tools like candlestick patterns and technical indicators (e.g., RSI, MACD) to identify potential reversals. Enter trades when these signals confirm a shift in momentum, ensuring proper risk management with stop-loss orders.
Learn more about: Understanding Day Trading Reversal Strategies
Learn about How Do Prop Firms Affect Day Trading Strategies?
What Should You Look for in a Reversal Trading Setup?
In a reversal trading setup, look for key indicators like price action signals, support and resistance levels, and overbought or oversold conditions. Confirm your setup with volume spikes or trend divergence. Timing is crucial; enter when the price shows signs of reversing, ideally at established support or resistance. Use stop-loss orders to manage risk effectively.
Conclusion about Timing Your Trades: The Art of Reversal Trading
Mastering the timing of reversal trades is crucial for successful day trading. By understanding reversal patterns, using key indicators, and considering market sentiment, traders can enhance their decision-making process. Avoiding common mistakes and effectively managing risk will further strengthen your approach. Remember, tools and techniques play a vital role in identifying the right moments to enter and exit trades. For deeper insights and support in your trading journey, DayTradingBusiness is here to guide you.
Sources:
- A Practical Guide to Trade Policy Analysis
- Back to Basics - Do Current Account Deficits Matter? - Finance ...
- Federal Trade Commission Act Section 5: Unfair or Deceptive Acts ...
- Skewness preference and the popularity of technical analysis ...
- Economic Interdependence and War: A Theory of Trade Expectations